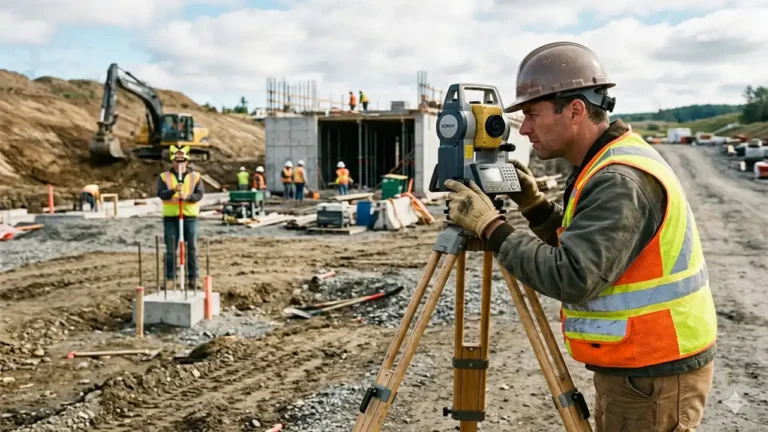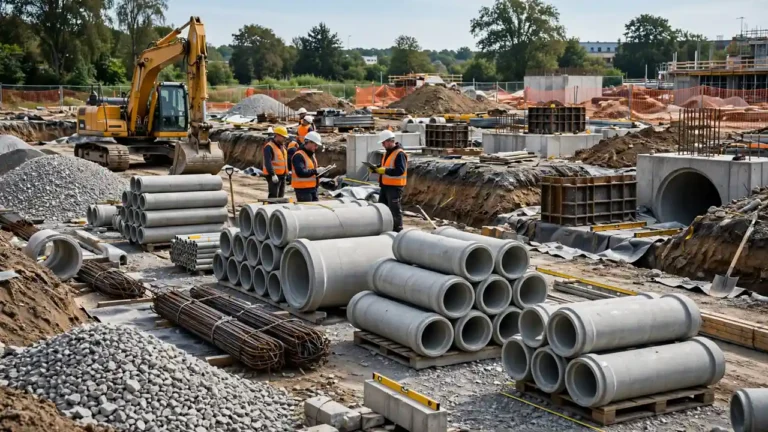

A single dropped wall panel can wipe out a season of profit on a Midwest precast job.
That is why construction project risk assessment impact probability levels matter now, as erection windows shrink and owners expect proof that hazards were ranked before the first crane pick.
When you score risk correctly, your safety dollars go where they actually prevent loss.
Key Takeaways
- A risk matrix ranks each hazard by likelihood (five levels, Certain to Rare) against consequence severity (four levels, Minor to Catastrophic).
- The 5×4 layout traces to the US Department of Defense’s MIL-STD-882B (1984), while OHSAS 18001 popularized a simpler 3×3 grid.
- Matrices compress risk: research shows typical grids correctly compare fewer than 10% of random hazard pairs, so you need precast-specific data alongside them.
New Bills Compliance Deadlines US States Construction Materials
What are construction project risk assessment impact probability levels?
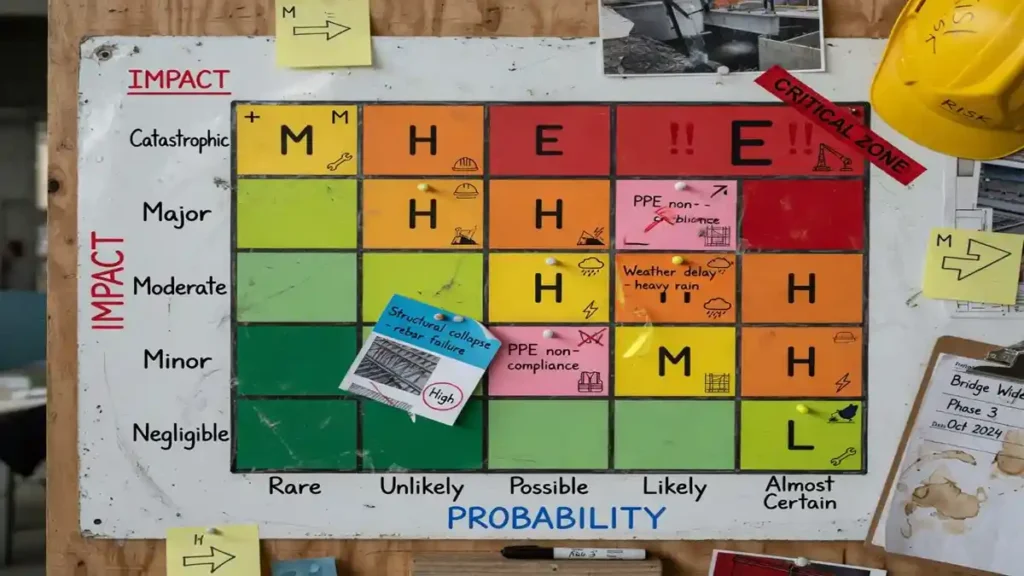
Impact-probability levels are the two scales that place every hazard on a grid. One axis measures how likely an event is.
The other measures how severe the outcome would be.
The Wikipedia risk matrix article describes the tool as a simple way to make risks visible and support management decisions.
It works best when neither probability nor severity can be estimated precisely.
Our analysis suggests precast work fits that description well: plant production is controlled, but field erection adds wind, crane, and sequencing variables that resist exact measurement.
How do the severity categories translate to a precast site?
The source defines four severity tiers. We mapped each one to a field condition our contractors see regularly:
- Catastrophic: death, permanent total disability, or total equipment loss, such as a wall panel toppling before bracing.
- Critical: hospitalization, permanent partial disability, or equipment damage, such as a crushed hand at a connection plate.
- Marginal: injury causing lost workdays or minor accident damage, such as a back strain while setting shims.
- Minor: injury without lost workdays and minimal environmental impact, such as a laceration during patching.
Likelihood runs across five levels: Certain, Likely, Possible, Unlikely, and Rare. The source warns that very low likelihood ratings are often the least reliable.
How do construction project risk assessment impact probability levels map to a matrix?
Each cell combines one likelihood level with one severity tier.
The result is a single risk rating you can act on. The table below follows the example matrix in the Wikipedia source.
| Likelihood | Minor | Marginal | Critical | Catastrophic |
|---|---|---|---|---|
| Certain | High | High | Very High | Very High |
| Likely | Medium | High | High | Very High |
| Possible | Low | Medium | High | Very High |
| Unlikely | Low | Medium | Medium | High |
| Rare | Low | Low | Medium | Medium |
A Rare but Catastrophic event, such as a crane failure during a heavy double tee pick, still lands at Medium.
That rating does not mean you can ignore it. It means you document the controls and confirm them before every lift.
Why do Midwest precast contractors need this now?
If you’ve been following precast concrete trends across the Midwest, this won’t come as a surprise.
Freeze-thaw cycles, compressed erection seasons, and larger panel sizes push both axes of the matrix up at once.
Construction industry insiders are noting a shift from qualitative labels toward quantitative scoring, a trend the source documents across manufacturing and production.
Schedule overruns and site incidents on large projects remain a recurring theme in ENR coverage.
The ISO 31000 standard frames risk as the effect of uncertainty on objectives, which covers cost and schedule as well as injury.
Owners now expect construction project risk assessment impact probability levels to cover all three.
Your scoring also rests on a long history of established standards:
- DoD Instruction 6055.1 (January 30, 1978) laid early groundwork for the risk matrix.
- MIL-STD-882B (March 30, 1984) defined a 5×4 matrix.
- AS/NZS 4360:2004 popularized a 4×4 format.
- OHSAS 18001 popularized a 3×3 format for occupational safety.
California Highway 166 Cuyama River Construction Lessons
How do you apply impact-probability levels on a precast project?
Our team observed that the strongest construction project risk assessment impact probability levels follow a fixed sequence.
Use these steps on your next job:
- List hazards by phase. Cover casting, yard storage, transport, erection, connections, and grouting.
- Define severity in your terms. Add cost and schedule thresholds to the four injury tiers.
- Write consistent likelihood labels. The source recommends a shared base term, such as very common to very uncommon, so each level ranks clearly against the next.
- Score each hazard. Place it in one matrix cell and record who scored it.
- Check code minimums. OSHA 29 CFR 1926.704 requires tilt-up lifting inserts rated at 2x, other precast inserts at 4x, and lifting hardware at 5x the maximum intended load.
- Assign controls. Source members from plants certified under the PCI certification program, and follow ACI ACI 306 guidance for cold-weather concreting.
- Rescore after controls. Repeat the scoring before each critical pick.
What are the limits of construction project risk assessment impact probability levels?
Matrices simplify risk, and they can also distort it. In What’s Wrong with Risk Matrices? (2008), Tony Cox found that typical grids correctly compare fewer than 10% of randomly selected hazard pairs.
He called this poor resolution, and he named the related problem of identical ratings for very different risks range compression.
Thomas, Bratvold, and Bickel (2014) showed that rankings shift with bin size and scale direction.
Change the scale, and you change the answer.
Multiplying rank numbers to create a “risk score” also produces an uneven distribution.
Our contractors take three practical lessons from this research:
- Pair the grid with data. Back each rating with insert load ratings, wind limits, and crane charts.
- Document judgment calls. Record why a hazard landed in its cell.
- Separate look-alike risks. Split any “High” hazards that differ sharply in cost or injury potential.
Scott County Iowa Approved Construction Bond Projects Shift
Construction Project Risk Assessment Impact Probability Levels for Precast Crews That is why construction project risk assessment impact probability levels matter now… @companyconcrete @engineers_feed @constructdive https://t.co/tuCHFFbXwh
— US News (@Us_news_ways) October 27, 2026
How will this impact your next build?
You win precast bids on price, but you protect your margin with risk control. Well-built construction project risk assessment impact probability levels give your crew, your insurer, and your owner one shared picture of every hazard.
That shared picture speeds approvals and focuses spending on real exposures.
Before your next erection mobilization, build your 5×4 matrix and score every pick. Then rescore it against OSHA 1926.704 insert ratings.